In 1960 Kennedy (43) was in a close race with Nixon (47). How has the age of the presidential candidates changed since then?

A wide range
How has the age of the American presidential candidates changed since 1960?
The complete table
A wide range
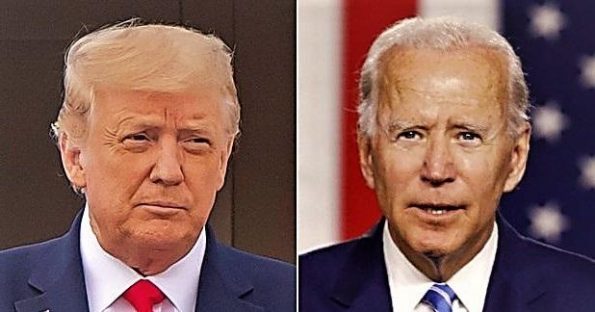
American citizens will elect a new (?) President on November 3rd, 2020. With Donald Trump (74) and Joe Biden (78) two, well, let’s say, very experienced candidates are eligible for them. Most people at that age have been retired for a decade. And are very far from their peak performance.
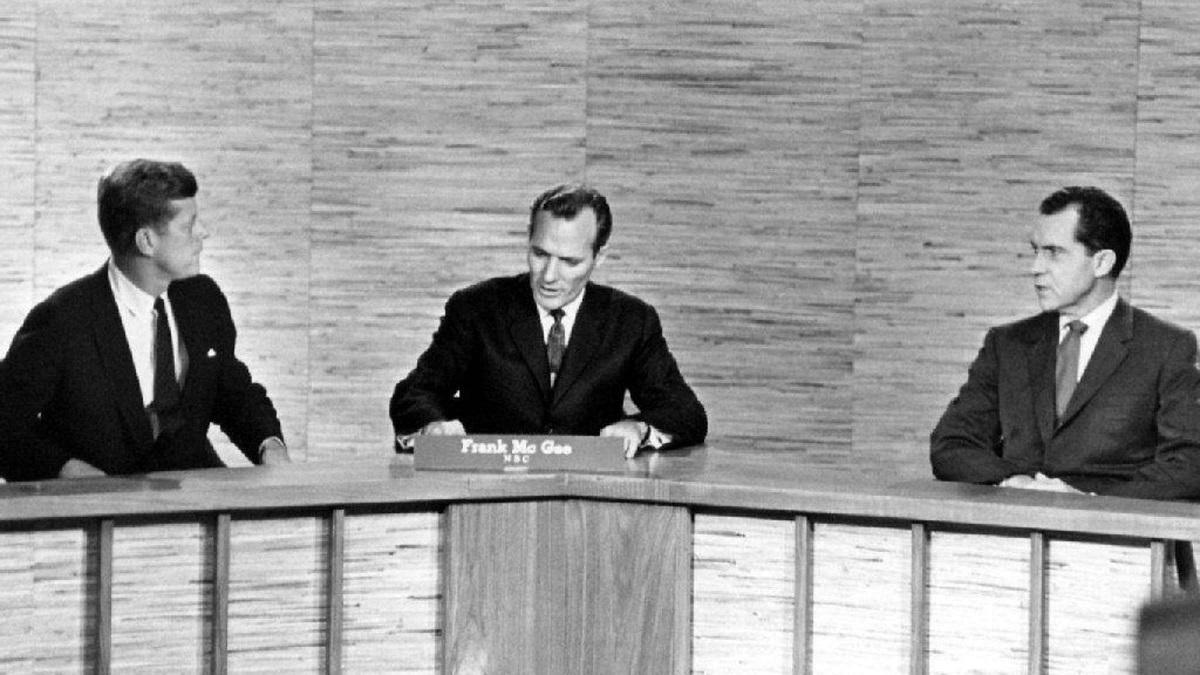
At the beginning of the 1960s, however, no one could speak of the aging of the American presidential candidates. A very young John F Kennedy (43) competed against Richard Nixon, who was just 4 years older.
After a legendary TV debate, the election results were incredibly close.
The majority of viewers then voted for Kennedy. Perhaps Nixon had the more pleasant voice, however. Because the majority of those listeners who had only followed the debate on the radio voted for him. (Which was of no use to him. Kennedy won the subsequent election by a narrow margin)
With an average age of 45, the Kennedy / Nixon team already set a clear scent mark.
But how did the median age of the American presidential candidates develop later? Did they age as well as many other western industrial societies? Or could, in later years, true to the motto, only new brooms sweep well, young dynamic politicians dominate the elections?
Let’s just take a look.
How has the age of the American presidential candidates changed since 1960?
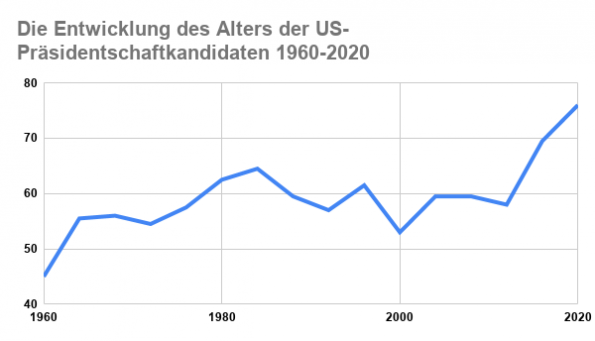
Uh no. Kennedy and Nixon actually remain the youngest of the presidential candidates, with a median age of 45.
Only one other couple came close with an average age of 52 years. It was the couple Bush Jr. and Al Gore from 2000.
The complete table
The following table is based entirely on the Wikipedia entries on the presidential candidates. I did not show surgical accuracy. I skipped day and month data. And then subtracted the years (election year – year of birth) from each other.
| Election year | average age | candidates |
| 1960 | 45 | Kennedy, Nixon |
| 1964 | 55,5 | Johnson, Goldwater |
| 1968 | 56 | Nixon, Humphrey |
| 1972 | 54,5 | Nixon, Mcgovern |
| 1976 | 57,5 | Carter, Ford |
| 1980 | 62,5 | Reagan, Carter |
| 1984 | 64,5 | Reagan/Mondale |
| 1988 | 59,5 | Bush Sen/Dukakis |
| 1992 | 57 | Clinton/Bush Sen |
| 1996 | 61,5 | Clinton/Dole |
| 2000 | 53 | Bush Jun/Gore |
| 2004 | 59,5 | Bush/Kerry |
| 2008 | 59,5 | Obama/McCain |
| 2012 | 58 | Obama/ Romnay |
| 2016 | 69,5 | Trump/Clinton |
| 2020 | 76 | Trump/Biden |
What do you think? That would be interesting! Just write your thoughts in the ⇓comment box below ⇓!
Schreibe einen Kommentar